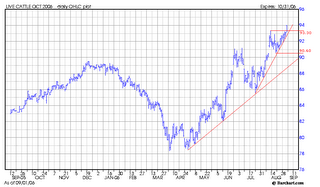
live cattle, cotton, corn 9/4
live cattleThe live cattle chart looks strong with the longer-term uptrend well intact and the shorter-term, very steep uptrend also holding it's ground. It wouldn't be surprising to see the longer-term trend tested at some point in the near future. The bottom of the renewed steep uptrend is at 90.60 and 90.00 looks to be the key area for the longer-term trend.

cotton
The downtrend in cotton is intact since January. The market looks poised to test flat support in the 51c area.

corn
The parabolic function turned to buy in late August. The chart still favors the bears but a test of 248 to 252 area seems likely in the near term. The market has not let go of the bullishness and this mentality given the fundamentals cannot be ignored.

gold
The gold market may have a recovery into the 640s and breaking back above the 650 barrier would renew some bullishness. The approximate downtrend since May will be violated with continued upside movement in the upper 640s. Flat resistence rests at 668.20 and 691.20.

A six month view of the dec gold chart effectively zooms in on the area of interest and shows the the downtrend from May was closed on or just above with action Friday, September 1. If the market fails on the upside as it stretches for 650, the downside could be significant, while the upside movers would next target the flat support previously noted at 668.20 if the violation of the trend is confirmed.


0 Comments:
Post a Comment
<< Home