corn and beans post significant moves monday
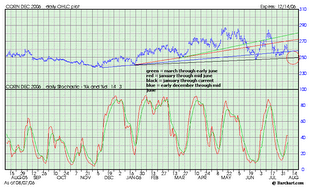
The following chart shows some different trendlines in the December '06 corn chart. The black trendline in the chart shows support from January '06 that may soon be tested. The older trends are drawn to illustrate the market's action when breaking through. If the flat support in the 248-252 area does hold then we could see a pretty sharp rebound (even if it is short-lived). There are some that are calling for the overdue breakdown in the corn market and their are others with precisely opposing opinions touting support that ranges from ethanol to weather damage.The chart does show that multiple trends have breached. Those downside breakthroughs coupled with the time of year we find ourselves in is only increasing the probability that the market will not resume the sharper (higher degree angle) uptrend in the near future. If it does, then the impetus would likely come from the USDA report on 8/11.

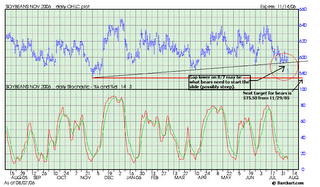
Soybeans posted a downside breakout that violated the long-standing trendline. This breakthrough could prove very significant for the coming months. Monday may have kickstarted the momentum needed by bears to start a sharply lower tone. The chart shows that the next support level is flat support from 11/29/05 at 575.50


0 Comments:
Post a Comment
<< Home