gold and grains 9/28
Gold had a possibly significant break out from a trading range by following through in the 606+ area for the Dec contract. In the overnight, gold surpassed 610, but has since subsided. If the momentum on the upside does not result in a push higher than where we are now, there could be slippage back to the 600 level and a plunge to challenge 580, 576, and 560 could be upon us. It all seems to depend on the swiftness of the decline. A slow drift might perpetuate the relatively meaningless movement we've seen recently - without any significant motivators for rallies or declines besides the technical heard.
Watching 606, 600, 580, 576, and 560. Low targets are conceivable but absolutely not a given.
The grains were weaker in trade Wednesday. Overnight they were a little stronger, but only gave back a portion of the gains from Wednesday. Seasonaility points to the potential for a slide to begin very soon. This may be more true for beans than corn. Everyone and their brother is clammoring about demand for corn and the ethanol craze etc. With beans, we seem to have an abundance and the question mark that remains is how South America will react acreage-wise to our price levels. Don't forget the rediculous state of their economy with interest rates through the roof.
If corn can continue with earlier strength to get through the 260 area basis Dec then we could see follow-through into the mid to high 260s. If, however, the current failure (down 5c on Wednesday) is perpetuated by declines into the 248-252 range then we could see a challenge to the 240 area. Despite what the demand bulls will tell you, even that 233.50 contract low would be within striking distance. If yields are relatively strong going forward, then the premium that was quickly factored into this market will be removed even more swiftly.
Sugar may have bottomed for the shorter term, with some strength returning in the last couple of trading days. Longer-term this thing could easily reach down into the 8-9c area.
Cattle is a difficult mix right now. The expected bearish report from Friday 9/22 hit the market with expectations having already been factored in. More analysis on this market is required to make an intermediate term call.
grains and crude 9/21
The grains moved higher Thursday, which may have been led largely by the belief that a low has been posted along with continued strong demand. Given the time of year, though, these gaps up may present selling opportunities in front of harvest pressure
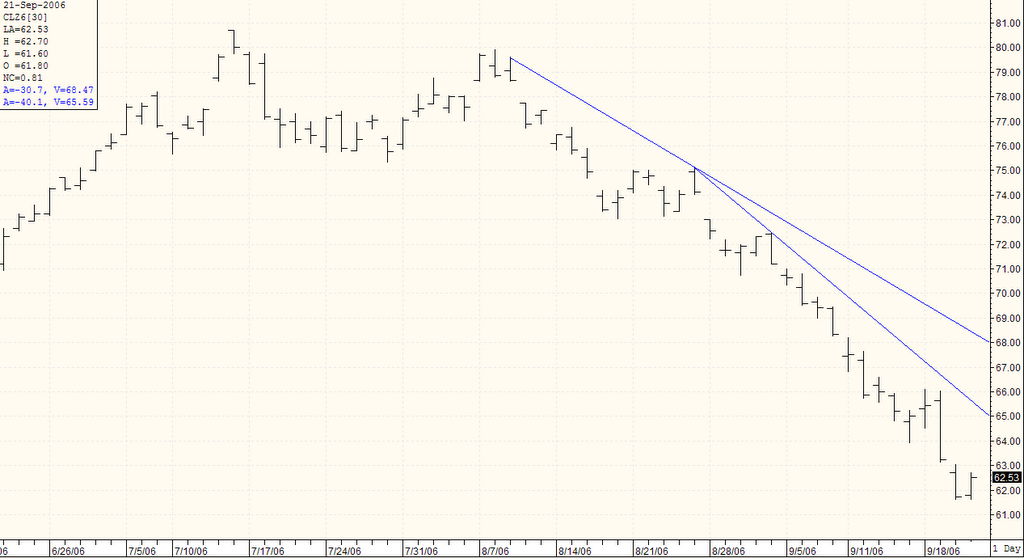
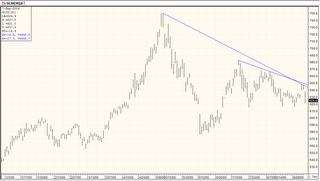
Crude has been steadly eroding with the end of the driving season along with bearish reserve info. It may soon be overdone on the downside and it only takes one geopolitical event/non-event to reignite the fire, so to speak. The chart below shows recent weakness. Participation using the eminiNY may be the safest approach.
Chart is from ProphetX.

gold 9/10
It looks like the evening Chicago trade has broken through the key 615 barrier I've been watching. Friday's trade pierced it by trading as low as 613.50, but closed at 617.30, nearly $4 higher than the low. With evening trade currently in the 606.50 area, all the market needs is a close below 615.00 to continue the bearish enthusiasm. The daily chart shows a downside objective of 559.30 for the December contract on eCBOT. (Note: both charts are from ProphetX)

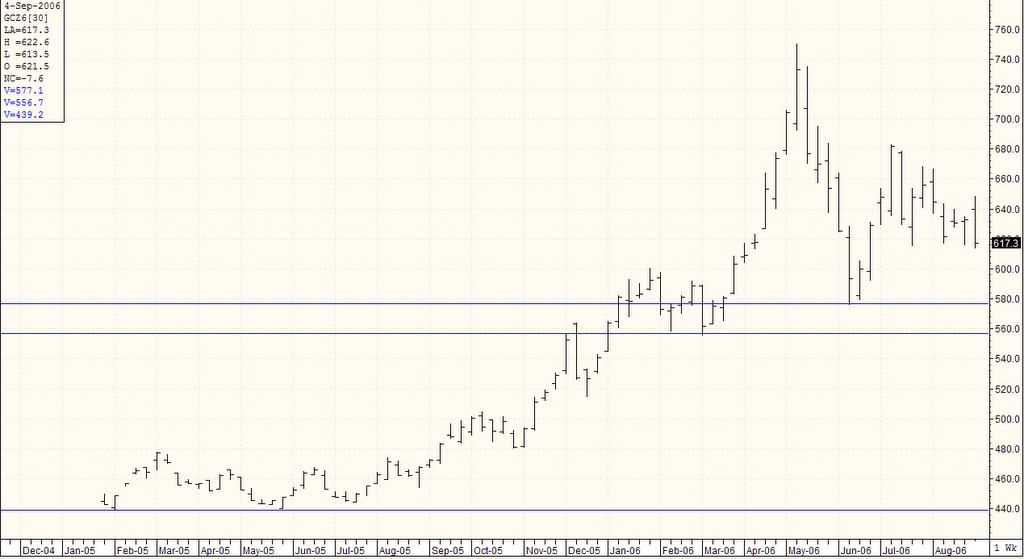
The weekly chart has a near-term bearish target in the 576 ballpark.

The recent thrust downward has been intense, so we may see the market take a breath in the near term. Psychological support at 600 may play a key role in determining whether the move has the stamina to get to the 580 or even 560 area.
real estate and commodity update 9/8
An article about the real estate market as it relates to student housing.
http://www.msnbc.msn.com/id/14041818/from/ETgold
Gold finished much lower wrapping up at 617.3 basis Dec after trading as low as 613.5. There could be some renewed upside if the lower part of this range around 615.00 holds (range noted in earlier post). From a swing trade perspective, this market could take a breather and not go directly after the challenge of support, but instead languish over the short term with little meaningful movement --
noise as I like to call it. A brief reprieve from the recent slide would increase the likelihood of a continued slide.
cornAgain this market didn't have a whole lot to say on Friday. Positioning in front of the USDA report is oftentimes a whipsawing type of event with movements between support and resistence levels. You can almost bet that we'll be sitting right on top of one of these levels going into the report.
feeder cattleThe chart for feeders closed just below the old resistance level (before the most recent week), which could be a sign of near-term weakness if the market corrects to the downside. This is an entirely possible scenerio given the magnitude of it's recent strength to push to new contract highs. (Note: chart is from ProphetX)
 sugar
sugar
This market was stronger Friday but closed below 12c. The chart
shows that the sharp downtrend has not been negated, but the market is above the gap left in Nov-05. The pause below the downtrend still puts the burdon on the bulls to overcome that obstacle. Friday they couldn't get it done but next week's action could be important in determining whether we're pausing in the bigger downward thrust or if the majority the bearishness has been factored in. (Chart is from ProphetX)

cotton
The downtrend has accellerated and the market may target the contract low at 51.20. At the least, the more gradual downtrends will be challenging to reverse.

gold, grains, sugar 9/8
goldThe chart for dec gold shows an intermediate downtrend that is intact. Clearing through the 615 area on the downside should open things up a bit, but confirmation will be needed. More downside potential exists.
 grains
Corn is mostly messing around right now without much meaning to the direction. The market will likely position itself ahead of the report at a support level due to the anticipation of bearish numbers, but there will be more significance for the October report when a higher percentage is harvested.
sugarThe chart may test the 11c area soon. The current pauses in the mid-11c area lend some credibility to the argument of an eventual thrust downward.
live cattle, cotton, corn 9/4
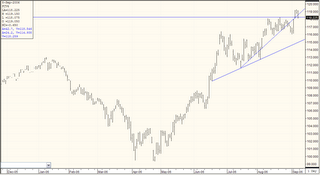
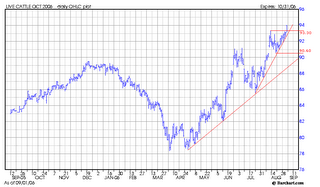
live cattleThe live cattle chart looks strong with the longer-term uptrend well intact and the shorter-term, very steep uptrend also holding it's ground. It wouldn't be surprising to see the longer-term trend tested at some point in the near future. The bottom of the renewed steep uptrend is at 90.60 and 90.00 looks to be the key area for the longer-term trend.
 cotton
The downtrend in cotton is intact since January. The market looks poised to test flat support in the 51c area.
 corn
cornThe parabolic function turned to buy in late August. The chart still favors the bears but a test of 248 to 252 area seems likely in the near term. The market has not let go of the bullishness and this mentality given the fundamentals cannot be ignored.
 gold
goldThe gold market may have a recovery into the 640s and breaking back above the 650 barrier would renew some bullishness. The approximate downtrend since May will be violated with continued upside movement in the upper 640s. Flat resistence rests at 668.20 and 691.20.

A six month view of the dec gold chart effectively zooms in on the area of interest and shows the the downtrend from May was closed on or just above with action Friday, September 1. If the market fails on the upside as it stretches for 650, the downside could be significant, while the upside movers would next target the flat support previously noted at 668.20
if the violation of the trend is confirmed.