gold 8/28
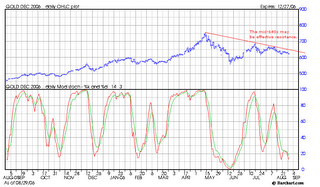
goldThe downtrend is holding. A shorting opportunity may exist in the mid-640s with buy-back stop placement just above 650. The market closed weak on Monday, August 28. Weakness may persist, but a bump higher could present an opportunity.
coffee 8/27
coffeeThe strength in coffee has held the uptrending line. Looking at the December chart shows that support may soon be tested and, if it holds, the follow-through strength will be important to watch.

With flat support for the contract resting at 98.00, the market has a lot of breathing room. Looking at the stochastics, we are borderline overbought and due for a correction, which makes watching any test of support even more important for emergent buying.
market thoughts 8/26
grainsLooking ahead at the upcoming week, I'm thinking about the yield prospects for corn and beans. Those prospects have likely improved significantly as of late, especially in the case of beans. Taking a step back from the near term price fluctuations--it truly is amazing to see where these markets have churned in recent months.
If corn has bottomed, then we could see an interesting dynamic begin to take shape with the longer-term bullishness returning sooner rather than later. The market could also languish or have a hard push lower. The Monday afternoon crop condition reports have been showing an improving crop condition rating for corn in all of the key states. This points to excellent yield potential and possibly much lower prices. There is reluctance for the market to stay down for very long at all. Some analysts are hopelessly attached (in love with) the position of being long corn because of the ethanol craze. The market looks ahead.
If the USDA turns out to have been low in their Aug-11 report then the market could have a longer-term bullish premium built back in over time as the demand keeps chewing through supplies. The market has reserved the right to break through on the downside as well, so this one could be tough to play. Technical indicators and general feeling about where the market psychology will take us is begging me to re-establish a fairly sizable bought position. Confirmation of strength in the coming week will offer some reassurance to me that the 238.50 resistance level breakthrough was significant intermediate to longer term. If the market is just playing around in the 240 area throughout the week without any noteworthy strength back in the mid-240 area then we could have a lull for the time being.
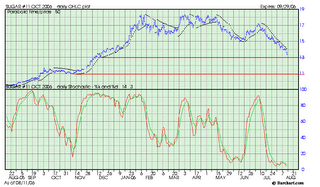
sugarA little strength but no followthrough buying emerged, so we could see some more weakness. The chart is telling me to wait on the short position to unfold further. There is still a target in the 11c area.
 cattle
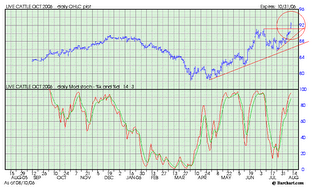
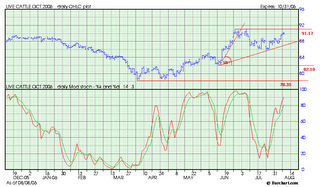
The strength that bulls were looking for was hit and miss this week. With the October feeder contract down to 116.70 just the other day, there is potential to just play around in the earlier defined trading range.

Technically, the case is reasonably strong for cattle to continue with their uptrend. Fundamentally, it feels like they've been overdone at this point. As noted before, be careful for a sudden burst of strength that comes out of nowhere. The uptrend from April-06 is intact dispite a intra-day spike.
trading sidenote "let your winners ride"
The positions that are winners are the hardest to hold on to because there is a natural impulse to book profits. While some argue that booking any profit is a good thing, oftentimes a trader can prematurely exit a trade without a sound reason for the exit. Just as is the case when an entry point, a trader needs an exit strategy... and the trader needs to follow that plan.
Entering a market when resistance or support holds and placing an exit stop just above or below that line has worked well in the past, but setting a
somewhat arbitrary stop behind the market doesn't make a lot of sense because market "noise" will oftentimes knock you out of a position that would have been much more profitable with a more scientific approach to stop placement. Watch for support and resistance stop setting locations and don't cheat yourself by putting the blinders on just to book a profit. It'll pay off over time.... this is a hard one.
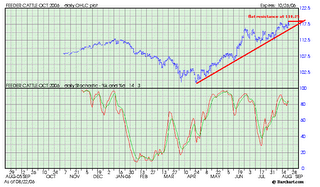
feeder cattle notes 8/22
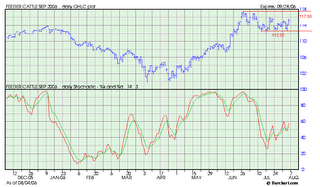
feeder cattleThis market is toying with the high with flat resistance at 118.25. Today it closed down after Monday's impressive strength. If this market can overcome the nearby hurdle on the upside, then there's no telling how far it could ascend, but, on the flipside, we're overextended and the probability exists for a hefty setback. The danger of shorting a market like feeders right now is there is no chart precedent for a resistance level above the recent highs. If 118.25 is overtaken, then any buy-back stop (covering a short) would likely be hit. Again, markets like this can be vacuous in nature.
- Some markets start to feel like a reckoning day is near and this may prove to be an example.
- The picture is reasonably bearish for the current price levels to be maintained. The talk is centered around regaining export demand and continued strength in the domestic market. Any faltering with these variables would likely result in at least a sign of that reckoning.
- From the technical perspective, the intermediate-term uptrend is intact but the overhead resistance is substantial.
- One could make an argument for initiating a short position to play the probability of at least a minor correction to the intermediate-term uptrending line. Bearish fundamental news could precipitate a breach of the uptrend and cause a significant tumble thereafter.
 sugar
sugarThe October contract is hovering in the 12c area and could soon break through that key barrier. If it does then the vacuous area (noted in previous posts) could provide a hard and fast dive to wrap up this retracement. Be patient for this one to break through 12c. My short position is a few weeks hold and it's definitely paid to only update stop placement using significant resistance areas.
A habit I've been reasonably successful of moving away from is becoming very comfortable with a profit because I feel that a market has been "generous" to me and thus setting my profit-protecting stop closer than the chart tells me to. This unnecessarily limits profits--though some would argue that is allows for the trader to "give back" too much of the original profits I have actually found results to be much to the contrary. Using this stop placement method
with the right markets has allowed me to catch the last and often best thrust of a move.
The reason I say "the right markets" is because there are absolutely certain markets in which this methodology is just asking for repeated setbacks. Swing trades often require a very defensive posture to protect accumulated profits from the trading channel. Positional trades require patience and commitment to the support and resistance levels. Different tools for different markets.
It, again, boils down to planning your trades and trading your plans.
sugar 8/21
The sugar market has fallen hard and fast lately. The rock-bottom area of support is in the 11c ballpark, but there are no guarantees the market can make it that far. I'm becoming increasingly defensive of this position because of the possibility for a hard and sharp recovery. Even if that bounce doesn't stick, my preference is to have a clean exit before hand and possibly re-enter on the short side. Some people would argue that I should stick to stop-setting in the upside resistance levels, but a trade with this accelleration and velocity potential is beginning to come up and gasp for air at some point. My trailing buy stop will be close behind market action.

corn and cattle 8/20
cattleThe cattle on feed came out at 107% of year ago levels which will likely spur selling on Monday's market open. I took profits on Friday ahead of the report on a short position. The reaction to this report is important. If there are indeed losses on Monday following the bearish number, then follow-through losses until midweek would confirm an intermediate-term shift in sentiment. The market had been in the high 92 levels for the October LC contract.

The October contract may head back down to the uptrending support line in the near term as the market figures out how to digest the variables in play.
cornI'm beginning to shift some of my study focus to the March '07 contract for corn and I may even look forward to the further out contract months. Reason being that the longer-term bullish sentiment is still intact but the Dec contract may not be the right time horizon to realize the best part of the continuation of the bullish pattern.

Although the March '07 contract has broken the longer-term uptrending line, the flat support level in the 245.25 area may prove a little tougher to break. The market is nearing a nice entry point possibility for a longer-term positional trade in corn. As noted, the demand picture is still very bullish the resumption of that sentiment will likely happen after most of the market is convinced that lows are in place and there could be quite a spectacular recovery.
That line of thinking has to be tempered by keeping the thought in mind that "big crops tend to get bigger" and the bearish USDA numbers released on Aug-11 may only be the beginning of a bearish break in this market.
With that said, longer-standing support lines make the buying opportunity relatively low in risk given the upside price potential. Another adage to remember in times like these is that
markets are most bearish at the bottom. We'll see how it plays out, but positioning with at least some cheap calls should be a reasonably conservative trade. This market's action early in the week will be important as traders attempt to find out what kinds of lows were posted last week.
usda crop progress report
cornThe corn market moved lower (at time much lower) on Monday. But the last 15-20 minutes of trading were again intense. The market dipped into the low 230s for the Dec contract only to rebound and close at 238.50. Though there was a jab below support in the 237 area, the close was in fact above support. This could prove important in coming days. Though, tonight (aug-14) corn will likely feel more pressure because the USDA's weekly crop progress report came out and showed that good/excellent ratings for the crop were unchanged from last week. However, and perhaps more importantly, the "good" category for Iowa increased from 41% to 45%. This may prove significant in tonight's market action. Be wary of this area... fresh contract lows during the day session leave the possibility open for a hard and fast fall should the funds roll over and liquidate. The massive longs the funds are holding could make this vacuous.
 cattle
The cattle market was initially higher then closed lower for the day. October live cattle closed below 92.00 at 91.80, which may be significant in coming days. There has been a strong and fast run-up in the cattle complex and anything that moves with that kind of intensity often has a reckoning day.
sugarSugar was again down hard Monday. The October contract closed at 12.50. This has been one of those rare instances were I actually caught a large portion of the downward move.
Observations about this:
- I was initially long and stopped out a couple of weeks back.
- Re-evaluating the chart and the shelf of support in the 14c area, I decided to reverse the position and ride the fresh momentum to the downside.
- The chart broke through 14c then 13c, and now we're in the mid 12c area.
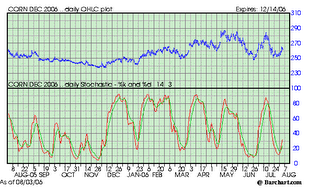
- Looking at the daily chart shows that this may be another vacuous zone where there is not a definitive support area. Take a somewhat defenisive posture to retain most of the profits achieved at this point, but be aware of the "nowhere-land" that exists on the way down to 10.92. Bears are no-doubt targetting this region.
Looking at the longer-term chart, the 11/10/2006 price of 10.92 at the bottom of the long rally eventually got us to 18.35, which is a differential of 7.43. We're currently at 12.50, which is a differential from the high of 5.85. The differential 5.85 (=18.35-12.50) represents a 79% retracement of the bull run. Granted it hasn't happened all at once, but the supply/demand factors for the upcoming surplus year perpetuated the placement of the straw that broke the camel's back.

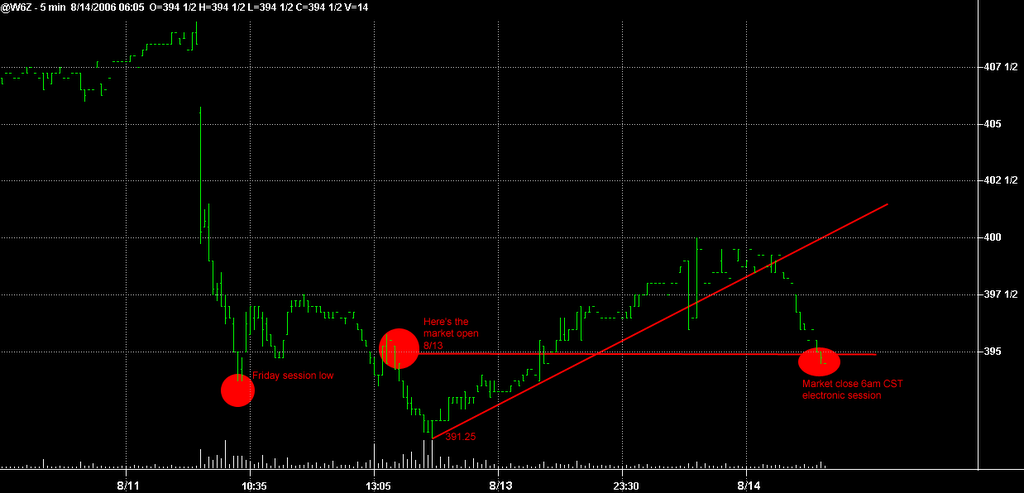
wheat notes 8/13
Wheat broke an 8-month support line on Friday. Intermediate to longer-term action may be directed at testing 2-3 key flat support areas (blue lines). If support holds, then wheat may have solid footing going forward.

This second chart is from the FAST trading platform. It shows the 5-minute chart from eCBOT trading 8/13 to the morning of 8/14.

sugar, corn, and gold sunday, aug 13
Looking at the corn chart, it seems possible that trade could break through support in the 237.75 area--though it doesn't seem terribly likely at this point. Evening trade tonight 8/13 has been as low as 237.25, but it quickly rebounded. The early part of the coming week may be telling of the intermediate-term direction of this market. Friday's high per acre yield estimate caused the trade to factor out about 14c from the market. With the demand factors still in place for corn, there could be a nice buying opportunity coming up. This price for corn coupled with the weakness of the dollar makes the US corn a value buy for many other markets in need of corn. Ours is cheap right now.

The sugar market may hit a vacuum soon with not a lot of chart barriers between close on Friday in the mid-13c range and 11c. Of course, nothing goes straight up or straight down for long. This has been a weak one lately and I'm going to hang on to the short for the time being.
Gold is weaker tonight, likely because of the peacekeeping action announced by the UN that is slated for Monday. This market has been churning for some time now. It's lack strength on some pretty turbulent news could be indicative of underlying short to intermediate term weakness. We've seen about $25 taken out of the market recently. It could only be the beginning of a larger dip, or the bottom end of the trading channel. As they say, bull markets need fed.
December 240 corn puts may have some strength early in the week. I don't want to let these diminish from the recent highs because they could churn back to semi-neutral territory if the corn market revives somewhat. Be active with these Monday and Tuesday for possible exit strategy.
Gold calls may be a value buy early in the week. Watch the wide trading range carefully.
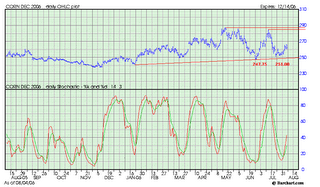
December coffee is resting on the upward sloping trendline. If it doesn't hold, then the contract could slip into the 105 neighborhood. Stochastics show a market on the verge of being overbought--perhaps the trade is feeling a shaky foundation of support. If support holds, then the move has potential to be quite strong.

post usda aug-11 report
The trading day was volatile. Corn was down hard, beans were modestly down on somewhat bearish news. As many analysts say, "it's not the news that's important, it's how the market
reacts to the news." Definitely a lot of truth in that statement.
Gold has been all over the map lately and closed at the bottom of a 20-25 dollar trading range. Live and feeder cattle have extended the dramatic gains from this week and are now overbought.
Weekend research:
- cattle puts to leverage for seasonal downtrend to emerge
- possible liquidation of 240 dec corn puts
- gold calls - is there value here
- coffee near-term potential
- sugar - downside soon overextended?
- wheat weakness opportunity?
usda report data
The report looks bearish corn and slightly friendly to beans.
152.2 bu/acre yield for corn and 39.6 bu/acre for beans
Now we get to see how it plays out.
pre-report notes
cornLooking at the data from the weekly crop progress report shows that a higher-percentage of the US crop is rated at good to excellent. I took the data and created a G/EX data column that is the summation of good and excellent percentages and then I did a descending sort to see how the states lined up. Note: the data source is the weekly crop condition report from the USDA.

Things are looking good. Friday morning's demand and yield projection numbers could be market movers. If demand is high or projected yield is lower than expected, then we could see a bump up. If production estimates are higher than expected then there might be some "elation" and wind may fall from the sails. As previously noted, the 248-252 area has been key. Intermediate term direction from this area may be determined with report data.
live cattle
Live cattle blasted through resistance Thursday. The acceleration of the move is intense and even the steeper uptrending line looks slow in comparison. The market is overbought and may be facing a correction in the near term.
live cattle, sugar, grain comments 8/8
So I'm re-reading a book called
The Disciplined Trader by Mark Douglas and this is definitely a "once-a-year" type of reminder book to read. A good quote from the inside flap is "Emotion kills successful trading." Objectivity is difficult at first when you're flat wrong
most of the time. The practice of having a pre-defined exit point for losing trades
before entering the trade is probably the best lesson I have learned about trading... ever. It's also probably the reason why I will be able to continue trading. Get over the ego and profits follow.
Looking at live cattle, there is a bullish uptrend intact that might be tested in the near future. If flat resistence in the 91.17 area is surpassed, then we could see a renewal of the steeper uptrend; however, the intensity of the recent climb may result in a "re-check" of the lower slope uptrend. Stochastics are in the overbought zone now.
Sugar closed below 14.00 Tuesday at 13.99. Corn is resting at 253 (basis Dec) and beans (basis Nov) are hovering around 577 pre-report.
You can only change the present and future. Do it.
corn and beans post significant moves monday
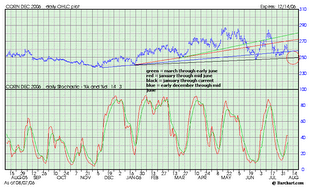
The following chart shows some different trendlines in the December '06 corn chart. The black trendline in the chart shows support from January '06 that may soon be tested. The older trends are drawn to illustrate the market's action when breaking through. If the flat support in the 248-252 area does hold then we could see a pretty sharp rebound (even if it is short-lived). There are some that are calling for the overdue breakdown in the corn market and their are others with precisely opposing opinions touting support that ranges from ethanol to weather damage.
The chart does show that multiple trends have breached. Those downside breakthroughs coupled with the time of year we find ourselves in is only increasing the probability that the market will not resume the sharper (higher degree angle) uptrend in the near future. If it does, then the impetus would likely come from the USDA report on 8/11.
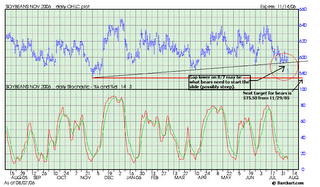
Soybeans posted a downside breakout that violated the long-standing trendline. This breakthrough could prove very significant for the coming months. Monday may have kickstarted the momentum needed by bears to start a sharply lower tone. The chart shows that the next support level is flat support from 11/29/05 at 575.50
sugar, feeder cattle, and corn notes august 6
Feeder cattle could have more strength in the coming week. The September contract has been bouncing around a lot lately and has significant resistence at 116.00 and at 117.50. Both of these areas are key... getting past the 115.50 has also been challenging lately. Last week the contract dipped into the 112.70 ballpark and came roaring back. If this contract cannot close above 116.00 in the near future then it could be looking at significant downside pressure. Right now it seems to be hanging in a trading range of 112.50-117.50, while that's an expensive range a breakout on either side could be very noteworthy.
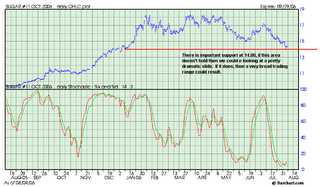
The sugar market sold off last week. Looking at the chart, the 14.00 area holds the key support line. A breach of this price area could perpetuate a dramatic slide. If a strong rebound from this support results, then we could have some degree of recovery or the beginnings of a very broad trading range.
Lastly, looking at corn, this evening's trade is down 2-3c at 259.50 for the Dec contract. The chart shown below illustrates the resilience of corn as it rebounds from support. It does, however, seem to be stalling this time. The question that's on everyone's mind is "how will the market react to the USDA report coming out 8/11. If it's bullish, then you can bet on a run for previous contract highs. If it's bearish then we may finally see a breaking down of support that's held rock-steady in the 248-252 level.
cattle recovery and corn posturing ahead of report
So during drive time today I was thinking through strategies for approaching the next few months of trading in the grains. As previously mentioned, August is the critical month for beans. Should there be a run-up in beans the corn will follow to some degree. Cash grain is still extremely cheap across the corn belt and it may very well be that way come November and December. With Dec corn futures currently trading over 260 and still possessing the potential energy to jump over the 270 threshold (without too much effort), this market is setting itself up for August to be an initiation point for a seasonal trade.
If corn is at 270+ in mid to late August and a trader sells the market short, this may be an opportunity.
This chart is from tradingcharts.com:
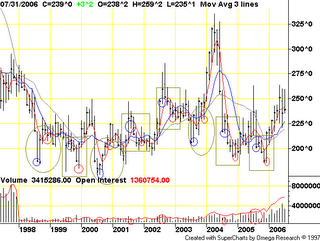
Looking at the monthly chart for corn... out of the most recent 8 years, 3 of those years have had an August low lower than the December low. The remaining 5 years have a December (harvest time) low that is lower than the August low. So 62.5% of the time the December low is lower than the August low. The August low is circled in blue and the December is circled in red. I put boxes around each of the years that the pattern of lower December lows worked and circles around the years it didn't work.
- 1998: 8/31 187.00 12/31 207.50 diff +20.50
- 1999: 8/31 201.25 12/31 180.00 diff -21.25
- 2000: 8/31 174.00 12/31 204.25 diff +30.25
- 2001: 8/31 220.25 12/31 205.25 diff -15.00
- 2002: 8/31 245.00 12/31 231.25 diff -13.75
- 2003: 8/31 206.00 12/31 229.00 diff +23.00
- 2004: 8/31 215.25 12/31 191.00 diff -24.25
- 2005: 8/31 200.00 12/31 186.00 diff -14.00
The math was in my head so this is only a ballpark data set. But observations are:
- 24.6 cents is the average loss differential for a short position in the three years the December low was higher than the August low.
- 17.65 cents is the average gain differential for a short position in the five years the Dec low was lower than the August low.
You can extrapolate more from the chart. For instance, look at the August lows and the December highs. This changes the odds. Also, instaed of looking at the lows of each month, looking at the closing price for the month yields a different result.
The bottom line is that there is a potential seasonal trade before us. More time should be invested into the different permutations.
One more thing about corn...
Another observation in passing is that looking at the December lows (red circles on the price chart), I noticed that buying in December for an intermediate term trade seems to have a high probability of success. Everyone knows that the harvest usually brings low prices because everyone has corn, for example, and the supply/demand forces forces depress price, but no one knows how low that "harvest low" will be and how high the trade could get between now and that low.
A note about cattleThe recovery in feeders on Friday wasn't enough to give too much ammunition to the bulls. It's still quite possible these things could tumble hard. 115.500 is a key area. Be careful as recoveries and declines come quickly.
Trading Account ManagementI have no idea how well-funded the average speculative account is, but I think it can reasonably be argued that one of the reasons that 9/10 people lose in futures is due to lack of a trading plan. Of course, there is the "human emotion" variable that skews reality and causes irrationality, but let's just say that a person has the ability to stick to a plan. Then the only obstacle that remains is to
develop a sound trading plan! Lack of sufficient funding for an account (a common reason why someone always seems to have a brother in-law that lost his tail in pork bellies...) only becomes an issue if the "worst case" hasn't been worked through and accounted for. If you understand and accept your maximum exposure on a given trade, then insufficient funding is a non-issue.
The problem seems to be that people do not have a predefined exit point in the event that a trade does not go their way (in the requisite time), so they let the losses continue to accrue. As the old adage goes, "the market will do exactly what frustrates the most traders." When bad things continue to happen to your trade, your hopes that the trade will recover turn to fear that it won't even get close. But the trader hangs on, hoping to salvage of the original capital. Before long, the trader runs out of money and taps out at precisely the
worst exit point. Shortly thereafter, the market turns around and does
exactly what the trader had originally foreseen! If only he could have hung on a little longer!!
Wrong! That sentiment will cause much pain. No matter if your account is $50,000 or $2M, the risk threshold for each trade should be a predetermined factor from which the trader does not deviate.
I mentioned irrationality -- aka deviating from a plan and pulling the trigger prematurely (or too late) on an entry or exit. As they say, "plan your trades and trade your plans." The market doesn't have it out to get you. The market could care less whether you win or lose a fortune. It's the most disconnected and unbiased mechanism that has the ability to teach a person volumes about their mental fortitude.... you are, after all, your own worst enemy. Having a plan before entering a market requires work. It's worth it. Do the research to find markets with:
- high risk to return ratios
- minimal loss with stop placement
- opportunity to participate in larger (intermediate to longer-term) trend at a value
- chance to diversify other trades
corn recovers, sugar tanks, and cattle churn - august 4, 2006
The cattle market has been moving back and forth for the past couple of weeks not really having a breakout on either side. In Thursday's trade, a (very fast) breakdown to the 112.700 level didn't last very long and prices for the September contract closed at 114.00. With the strong corn rally to 265.50 basis Dec in the overnight trading session, cattle may struggle on Friday. That, coupled with the tendency for cattle to find a bottom seasonally in the near future could apply the needed pressure to test some support levels.

Feeder cattle are testing the bottom of a shelf and if they plung through the fall could be fast and hard. If the corn rally continues that the probability of this threshold being broken increases. I don't believe it would take much to set-up a sharp sell-off. That said, if support holds then we've seen in recent trading sessions how quickly cattle and rebound.
A sell off in sugar prompted some heavy losses in recent trading sessions. The October contract may look to 14c for support. If the downward momentum continues, then this market could take some time finding support in lower layers.
The corn rally overnight is interesting for a number of reasons--most of which have been noted in this blog at one point or another, but here's the thing: the report due out August 11 has the market posturing itself for the news. Premium is being factored in for the potentially bullish news. How much higher could we see this market move? No one has a clue. Bottom line is this: we had a run-up early in the season, had a July "gift" as I like to call it with Dec corn as high as 284 and now we're back in the mid-260s coming off of recent lows in the 250 area. Looking at this market from the perspective of both a futures and options trader is intriguing.
- as bullish sentiment continues to build, the premium for put options below the markets by 20-30c will become a bargain-basement value
- seasonal trends tell us that highs are rarely made at harvest time, which could mean that a selling opportunity may soon be upon us.
Stochastics reveal that the oversold territory has quickly resulted in a recovery, which could be indicative of an extremely deeply-planted support shelf that will be a tough nut to crack on the downside. Demand levels are high, nervousness about carry-out is high, and the potential for some western cornbelt yield damage has made enough nervous to prevent the slide thus far. Crop conditions reports, weather, and the upcoming production report are weighing on traders' minds.


